Rudolf Hoehler
2015-06-17 12:13:41 UTC
Saicom Offers Inbound and Outbound Call Centre Solutions
Hello All,
Busy playing around with Observium and my graphs don't work. :)
Jokes aside, very cool piece of software, but my graphs all display -NAN as values.
The snmp walk is working and pulling information and it's displaying fine on the web interface, but the graphs don't display the values - sceenshots:
Loading Image...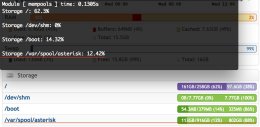
Loading Image...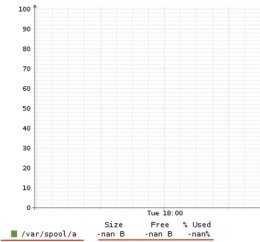
I followed the wiki instructions, double checked my bash history and it seems fine.
Running Debian 7 - Debian 3.2.65-1 x86_64 GNU/Linux
Server has 16gigs of RAM and 8 CPU cores.
On the mailing list people have warned agaistn a 1.5 version of rrdtool, but I am running version 1.4.7.
_____________________________________________________________
rrdtool -v
RRDtool 1.4.7 Copyright 1997-2012 by Tobias Oetiker <***@oetiker.ch>
Compiled Aug 2 2012 07:02:39
_____________________________________________________________
PHP Version seems fine.
_____________________________________________________________
php -v
PHP 5.4.41-0+deb7u1 (cli) (built: May 22 2015 12:49:18)
_____________________________________________________________
In the MySQL DB, the storage-state table seems fine, but I cannot find any historic data in the database - where should I look for this information?
_____________________________________________________________
mysql> select * from `storage-state`;
+------------+----------------+--------------+---------------+--------------+--------------+--------------+
| storage_id | storage_polled | storage_size | storage_units | storage_used | storage_free | storage_perc |
+------------+----------------+--------------+---------------+--------------+--------------+--------------+
| 1 | 1434541853 | 277800820736 | 4096 | 173082042368 | 104718778368 | 62 |
| 2 | 1434541853 | 8341504000 | 4096 | 0 | 8341504000 | 0 |
| 3 | 1434541853 | 397803520 | 1024 | 56981504 | 340822016 | 14 |
| 4 | 1434541853 | 984341426176 | 4096 | 122228555776 | 862112870400 | 12 |
+------------+----------------+--------------+---------------+--------------+--------------+--------------+
4 rows in set (0.00 sec)
Thanks for your time folks, appreciate any help.
Regards,
Rudolf
Hello All,
Busy playing around with Observium and my graphs don't work. :)
Jokes aside, very cool piece of software, but my graphs all display -NAN as values.
The snmp walk is working and pulling information and it's displaying fine on the web interface, but the graphs don't display the values - sceenshots:
Loading Image...

Loading Image...

I followed the wiki instructions, double checked my bash history and it seems fine.
Running Debian 7 - Debian 3.2.65-1 x86_64 GNU/Linux
Server has 16gigs of RAM and 8 CPU cores.
On the mailing list people have warned agaistn a 1.5 version of rrdtool, but I am running version 1.4.7.
_____________________________________________________________
rrdtool -v
RRDtool 1.4.7 Copyright 1997-2012 by Tobias Oetiker <***@oetiker.ch>
Compiled Aug 2 2012 07:02:39
_____________________________________________________________
PHP Version seems fine.
_____________________________________________________________
php -v
PHP 5.4.41-0+deb7u1 (cli) (built: May 22 2015 12:49:18)
_____________________________________________________________
In the MySQL DB, the storage-state table seems fine, but I cannot find any historic data in the database - where should I look for this information?
_____________________________________________________________
mysql> select * from `storage-state`;
+------------+----------------+--------------+---------------+--------------+--------------+--------------+
| storage_id | storage_polled | storage_size | storage_units | storage_used | storage_free | storage_perc |
+------------+----------------+--------------+---------------+--------------+--------------+--------------+
| 1 | 1434541853 | 277800820736 | 4096 | 173082042368 | 104718778368 | 62 |
| 2 | 1434541853 | 8341504000 | 4096 | 0 | 8341504000 | 0 |
| 3 | 1434541853 | 397803520 | 1024 | 56981504 | 340822016 | 14 |
| 4 | 1434541853 | 984341426176 | 4096 | 122228555776 | 862112870400 | 12 |
+------------+----------------+--------------+---------------+--------------+--------------+--------------+
4 rows in set (0.00 sec)
Thanks for your time folks, appreciate any help.
Regards,
Rudolf
--
Rudolf Hoehler
Technical Team Manager
Office: 0861 SAICOM (724 266)
Direct: 010 140 5104
Support: 010 140 5050
Cell: 083 644 7800
Fax: 010 140 5001
Visit our website: www.saicomvoice.co.za
Rudolf Hoehler
Technical Team Manager
Office: 0861 SAICOM (724 266)
Direct: 010 140 5104
Support: 010 140 5050
Cell: 083 644 7800
Fax: 010 140 5001
Visit our website: www.saicomvoice.co.za